W2654 Data Visualization
From Coder Merlin
Revision as of 14:10, 20 June 2019 by Chukwuemeka-tinashe (talk | contribs) (Merlin moved page Project-2652 to W2654 Data Visualization: Improved navigation)
Within these castle walls be forged Mavens of Computer Science ...
— Merlin, The Coder
Prerequisites[edit]
Introduction[edit]
This tutorial will provide an introduction to Data Visualization.
Research[edit]
- Read Data Visualization (Wikipedia)
- Read Wind Barbs (Mesonet)
- Read Okta (Wikipedia)
Experiment[edit]
First Steps[edit]
Create a new Igis shell project within your "project" directory.
cd ~/projects
git clone https://github.com/TangoGolfDigital/IgisShell project-2652
Enter into the Sources directory of the new project.
cd project-2652/Sources/IgisShell/
Copy your main.swift file and your Example-metars.csv file from project-2651.
cp ../../../project-2651/main.swift Metar.swift
cp ../../../project-2651/Example-metars.csv .
- Remove any code from global scope in the Metar.swift file
- Compile the project to ensure that it builds properly
Exercises[edit]
- In main.swift, choose a collection data type and read the data from the Example-metars.csv file into that type using your Metar class as the element type. Note that you must read the entire file, even if there are mistakes or omissions in that file. In such a case, you may skip only the errant line after printing a warning message to the console which must include the errant line number.
- Find a map of the United States suitable for use as the background of a weather map.
- Select a few metars from each state (except in the northeast where you may select only one per state). Using Igis, with the map as a full-screen background, plot the temperature (in celsius) of the station at the correct location on the map.
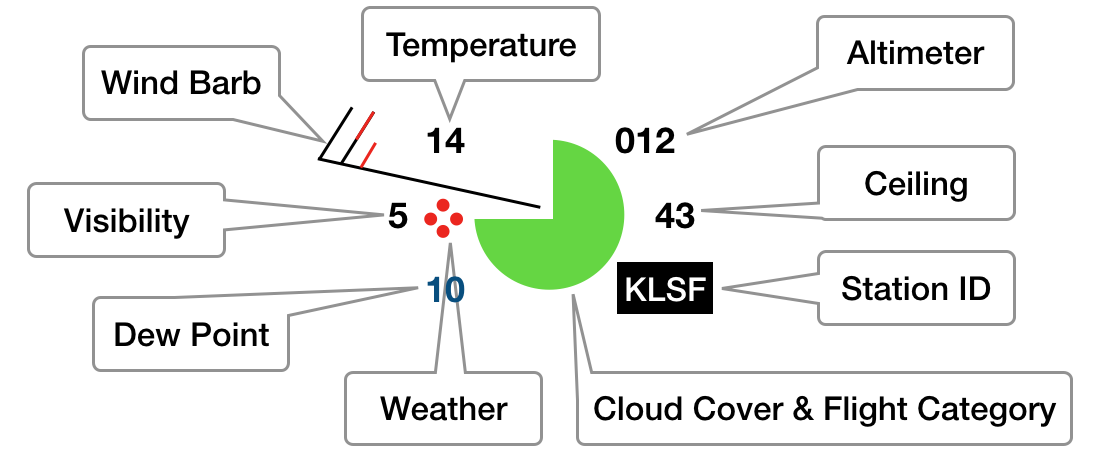
- Now, at each station, produce a "Station Plot" in accordance with the station's data using the format indicated:
KLSF 270055Z AUTO 29016KTG23 5SM +RA BKN043 OVC055 14/10 A3012
Flight Category Colors: ■ VFR ■ MVFR ■ IFR ■ LIFR
Hints:
- This code snippet may be helpful Code_Snippet:_Read_File
- This date formatter may be helpful ISO 8601 Date Formatter (Swift Documentation)
- While reading the file, you may find it helpful to print debugging output, including the line number and contents of that line, prior to processing the line. This will help you to more quickly identify errors.
- More information about Metars and presentation may be found at FAA Circular
- Page 3-9, Table 3-2 describes Metar Notations for Reporting Present Weather
- Page 5-3, Figure 5-3 describes a Surface Analysis Chart Station Plot Model
- Page 5-5, Figure 5-6 describes common weather symbols

